92
January 2019


ARTICLES
Gender and equity: some quick facts about gender differences in Catalan universities
Josep Joan Moreso (AQU Catalunya's President) and Daniel Torrents (Senior advisor of Internationalisation and Knowledge Generation Department)
Gender equality is one of the UN's Sustainable Development goals for 2030, and it goes without saying that this also involves higher education institutions in Catalonia.
Gender inequalities are the structural outcome of different social roles and forms of more or less explicit violence that raise objective and subjective barriers on the path to equality. A rethinking and diagnosis of these inequalities are key drivers on the path to gender equality, and this has already begun at many observatories, units and entities on numerous levels of the university system.
The main ideas set out below, which were presented at the International Conference on Humanities and Higher Education, outline various gender differences in institutions in Catalonia:
A majority in institutions, but not in all disciplines
- The presence of female students in universities in Catalonia has considerably increased since the 1970s, when they accounted for 36% of all students, to a stable figure of around 54%.
- There do however continue to be differences in the choice of degree course, ranging from 80-90% in care-related programmes (Pedagogy, Nursing, Education, Therapy) and the Arts, to 5-15% in technical programmes (IT/Computer Science, Industrial Automation, Forestry Science ).
| TOP 5 | % females |
|---|---|
| Therapy and rehabilitation | 92,0% |
| Pedagogy and Psychopedagogy | 83,9% |
| Teaching | 82,9% |
| Nursing | 82,3% |
| Fine Arts | 80,8% |
| BOTTOM 5 | % females |
|---|---|
| Mechanical Engineering and Industrial Design | 18,1% |
| Telecommunications | 16,3% |
| IT/Computer Science | 14,4% |
| Electronic Engineering and Automation | 11,9% |
| Forestry Science | 6,7% |
Greater workload but better performance
- There were more females who combined studying for a degree with paid employment (52% compared to 49%); female students enrol in more credits; and female students spend more time on house work and care-related activities (9 hours compared to 8 hours on average). This is true across all disciplines.
- In spite of this greater workload, university performance indicators such as the credit pass rate, the (non-) drop-out rate and the credit efficiency rate, are more positive for female graduates than for males, again across all disciplines .
| Credit completion/pass rate | Credit efficiency rate | 1st year drop-out rate | ||||
|---|---|---|---|---|---|---|
| Males | Females | Males | Females | Males | Females | |
| Humanities | 79.3% | 83.8% | 92.3% | 93.1% | 16.5% | 12.2% |
| Social Sciences | 81.3% | 86.2% | 89.8% | 93.2% | 7.5% | 5.7% |
| Experimental Sciences | 85.9% | 89.9% | 94.3% | 95.1% | 7.3% | 5.2% |
| Health Sciences | 80.3% | 87.4% | 89.7% | 93.3% | 8.8% | 5.8% |
| Engineering | 73.5% | 79.7% | 88.3% | 90.5% | 10.9% | 8.9% |
| Total | 79.3% | 87.2% | 93.6% | 90.5% | 10.1% | 6.9% |
Credit completion/pass rate: credits passed/enrolled; Credit efficiency rate: credits passed/exam taken; 1st year drop-out rate: First-year students who did not enrol in the following academic year (2014 cohort)
The gender pay gap and graduate glass ceiling
- On average, male graduates earn 25% more than female graduates three years after graduating. Various studies point to the fact that differences in salary are irrespective of the degree course taken, age and work hours (e.g. Fachelli & Planas, 2016).
- The full-time job rate is also higher for males across all disciplines (85% compared to 71%).
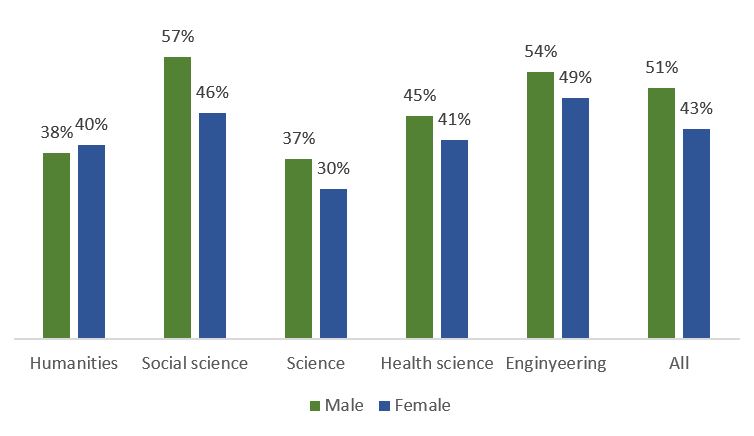
- One revealing indicator among master's graduates is that 43% of female graduates have responsibilities over others. In the case of males it is 51 %.
The glass ceiling of teaching staff at HEIs in Catalonia
- A higher proportion of male graduates occupy the highest positions on the academic scale (13% of total male staff compared to 4% females), whereas in the initial stages of the scale there are no important differences.
- Is this a cohort effect (there used to be fewer female graduates pursuing an academic career) or a structural inequality? It is difficult to determine this from the available data, although it is undoubtedly advisable to second-guess this .
Academic categories according to age and gender (% of the absolute total)
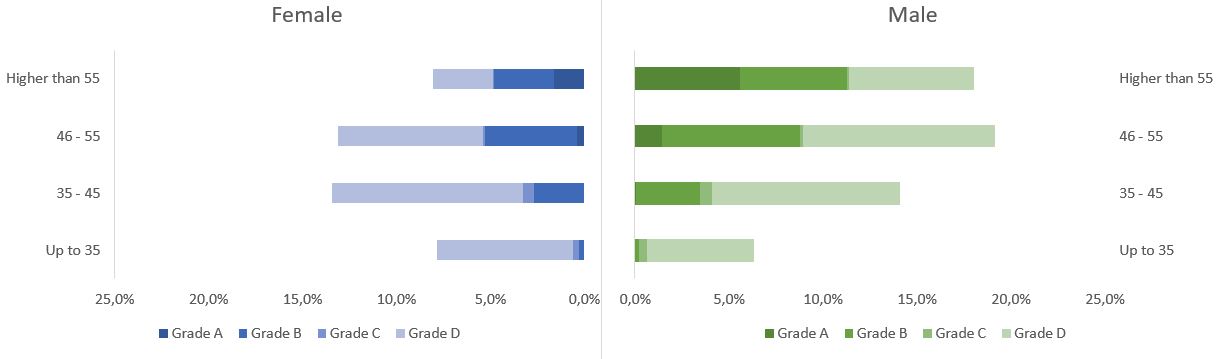
Source: public universities (main faculties) in Catalonia, 2017. 87% of the teaching staff, UNEIX; Classification grades given in the Frascati Manual (OECD): grade A: the single highest grade/post at which research is normally conducted, grade B: Researchers working in positions not as senior as the top position (grade A) but more senior than newly qualified doctoral graduates, grade C: the first grade/post into which a newly qualified doctoral graduate would normally be recruited i grade D: Either doctoral students who are engaged as researchers, or researchers working in posts that do not normally require a doctorate degree.
References
- Fachelli, S. & Planas, J. (2016). Evolució de la inserció professional dels graduats universitaris: de l'expansió a la crisi duradora (Trends in the occupational integration of graduates: from expansion to long-lasting crisis). Barcelona: AQU Catalunya


![]()
c/. dels Vergós, 36-42. 08017 Barcelona. Tel.: +34 93 268 89 50
© 2019 AQU Catalunya - Legal number B-21.910-2008