54
May 2011


ARTICLES
Fourth survey on the labour market outcomes of graduates from universities in Catalonia
Lorena Bernáldez Arjona - Manager assistant adviser of AQU Catalunya
Surveys on the labour market outcomes of graduates (graduate employment outcomes) are of fundamental value for any higher education system. Firstly, they provide information on the match and trends between supply and demand, and the figures are highly dependent on the situation in the labour market. Secondly, they provide indicators of the quality of education in terms of the prospects of graduates in the labour market, which is fundamental information for the design and monitoring of study programmes, particularly those that are professionally orientated. Thirdly, the data gathered in these studies is highly useful for career and professional guidance purposes and services, with the information that they provide being of particular relevance at a time of economic crisis like the present.
Graduate employment surveys produced jointly by an higher education system as a whole, like the one being presented here, have the added value of providing a system overview that makes it possible to contextualise the data obtained from a university, faculty or degree programme. As such, surveys on the graduate population provide key information for quality assurance processes in higher education institutions (HEIs).
It was for this reason that, ten years ago in 2001, the Catalan public universities, represented by their university councils and coordinated by AQU Catalunya, jointly carried out the first study of the labour market outcomes of their graduates in 2001 and subsequently repeated it every three years since then. The fieldwork for the fourth study has now been completed and it comprises:
- The fourth survey of graduates from Catalan universities (both public and private).
- The second survey of doctoral degree/PhD holders from Catalan public universities.
- A gender-related follow-up study of graduates 10 years after graduation.
The descriptive data of the sample obtained in the three studies are given below. It is anticipated that the results of the graduate study will be presented in July, and those from the PhD survey and follow-up study at the end of 2011.
| Graduates | PhD holders | Gende | |
|---|---|---|---|
| Population | 3 years after graduation | 3 years after PhD | 10 years after graduation |
| Dates | 24 January to 28 March | 22 February to 25 March | 3-25 March |
| Interview timetable | 9 a.m. to 10 p.m. | 9 a.m. to 10 p.m. | 9 a.m. to 10 p.m. |
| Average telephone call time | 13'40" if working 16' 4" if not working now 4'44" if they have never worked |
12'22" if working 13'13" if not working now 9'7" if they have never worked |
13'26" if working 11'22" if not working now 3'24" if they have never worked |
FOURTH SURVEY OF THE LABOUR MARKET OUTCOMES OF THE GRADUATE POPULATION FROM CATALAN UNIVERSITIES
The reference population for the survey was the graduate population (graduating class) that completed their studies at the end of the 2006-2007 academic year. In the case of graduates in Medicine, the reference population was the graduating class at the end of the 2003-2004 academic year.
The main new development of this fourth survey is the inclusion of the private universities in the survey. This means that, for the first time, all twelve universities in the higher education system in Catalonia (seven of which are public, three private and two that are a combination) participated, in addition to twenty-two affiliated institutions that took part in the survey for the first time.
In total, the reference population was 28,616 graduates, the actual sample obtained was 16,182 (56.5%), and the sample error was 0.52%. In comparison to the first graduate labour outcomes survey (see Table 2), there was an increase in the sample size from 9,765 interviewed graduates to 16,182, which is a 66% increase. The fact that funding for these surveys comes almost entirely from the universities shows both the usefulness of the data obtained and the added value of the universities jointly carrying out surveys of this nature.
| Year | Population | Sample | Response rate | Sample error | Participating universities |
|---|---|---|---|---|---|
| 2001 | 21,178 | 9,765 | 46.1% | 0.74% | UB, UAB, UPC, UPF, UdG, UdL, URV |
| 2005 | 21,767 | 11,456 | 52.6% | 0.64% | UB, UAB, UPC, UPF, UdG, UdL, URV |
| 2008 | 24,169 | 12,553 | 51.9% | 0.62% | UB, UAB, UPC, UPF, UdG, UdL, URV, UOC and UVic |
| 2011 | 28,616 | 16,182 | 56.5% | 0.52% | UB, UAB, UPC, UPF, UdG, UdL, URV, UOC, URL, UVic, UIC, UAO and 22 affiliated institutions |
Diagram 1. Distribution of the survey population from the graduating class of 2006-2007 in Catalonia (campus-based universities) according to gender
In both this survey (2011) and the previous one (2008) there was a higher proportion of female students (60% females compared to 40% males).
Diagram 2. Distribution of the survey population from the graduating class of 2006-2007 in Catalonia (campus-based universities) according to age at the time of the survey
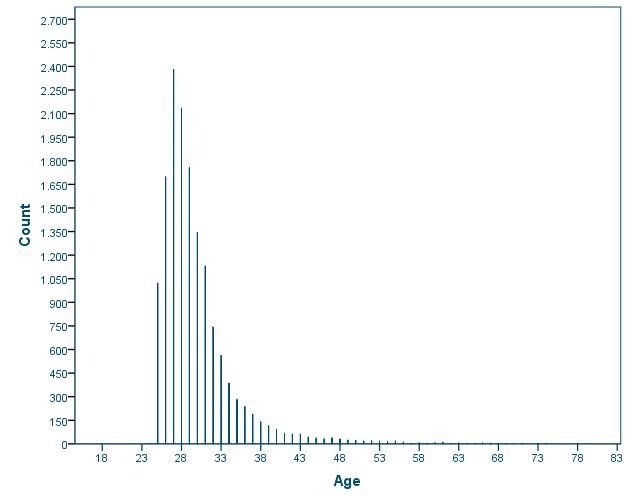
NB: Diagram based on 14,595 individuals whose date of birth was available.
All of the graduates participating in the survey were aged between 24 and 78, with an average age of around 30. 70% of the survey population was aged between 25 and 31.
Public and private campus-based universities
77.8% of the survey population from campus-based universities in Catalonia were graduates from public universities in Catalonia. Of the remainder, 14.2% graduated from private universities and 8% from affiliated institutions.
| Sample | % | |
|---|---|---|
| Public universities | 11,843 | 77.8% |
| Private universities | 2,262 | 14.2% |
| Affiliated institutions | 1,123 | 7.4% |
| TOTAL | 15,228 | 100% |
The majority of the respondees either graduated in the Social Sciences (46.2%) or Engineering/Architecture (24.7%). These were followed by the Humanities (11%), the Health Sciences (11%) and the Experimental Sciences (7.1%).
From a comparison of the two diagrams showing the graduate distribution according to field of study at the seven public universities between 2008 and 2011, it can be seen that the distribution remained practically the same. On the other hand, the composition of the public and private universities (diagram 4) was fundamentally different. Due to the lower volume of the private universities, their inclusion in the survey has led to few changes in the composition of the sample according to field of study, the main one being the higher representation of the Social Sciences and Health Sciences, and a slightly lower one for the Humanities and Experimental Sciences.
Diagram 3. Distribution of the survey population from the graduating class of 2003/2004 in Catalonia (public universities) according to field of study (discipline). 2008 graduate labour market outcomes survey
Diagram 4. Distribution of the survey population from the graduating class of 2006-2007 in Catalonia (campus-based universities) according to field of knowledge (discipline) and type of university
Public universities
Private universities
New degree programmes
This fourth survey includes, for the first time, degree courses covered by the new academic regulations, such as the Bachelor programmes in Design, International Business Economics, Audiovisual and Multimedia Studies, Multimedia Studies, Photography and Digital Creation and the Master's programme in Multimedia Studies. In addition to these degrees, the inclusion in the survey of the private universities and affiliated institutions has widened the typology of degree studies analysed, and the survey now includes for the first time, for example, studies such as the Sciences of Physical Activity and Sport, Design Studies, International Business Economics, Audio-visual and Multimedia Studies, and Aviation, amongst others. Graduates from recognised Master's programmes were not included in the survey as it was considered expedient to wait at least one more year in order for there to be a larger volume of Master's programmes with graduates.
The large sample that was obtained translates into very low sample errors, as shown in Table 4, ranging from 1.99% for graduates in 3-year Health Science programmes to 8.71% in the Classical Philology group, which assures the good representativeness of the results obtained
| Subject studied | Population | Sample | Sample error (%) |
|---|---|---|---|
| Geography and History | 883 | 598 | 2.32% |
| Philosophy and Humanities | 288 | 195 | 4.08% |
| Comparative Studies | 81 | 60 | 6.61% |
| Catalan and Spanish Studies (Philology) | 218 | 166 | 3.80% |
| Modern Languages (Philology) | 605 | 396 | 2.96% |
| Classical Philology | 57 | 40 | 8.71% |
| Fine Arts | 472 | 216 | 5.02% |
| Economics, and Business Administration and Management | 1,933 | 986 | 2.23% |
| Business Studies | 1,745 | 660 | 3.07% |
| Law | 1,268 | 583 | 3.05% |
| Labour Science | 1,080 | 614 | 2.65% |
| Politics | 524 | 346 | 3.14% |
| Communication | 1,074 | 655 | 2.44% |
| Documentation | 159 | 109 | 5.39% |
| Psychology | 986 | 376 | 4.06% |
| Pedagogy | 488 | 320 | 3.28% |
| Teaching and Education | 2,895 | 1,922 | 1.32% |
| Tourism | 344 | 240 | 3.55% |
| Sport | 323 | 231 | 3.52% |
| Chemistry | 425 | 249 | 4.08% |
| Biology and Nature | 979 | 615 | 2.46% |
| Physics and Mathematics | 289 | 221 | 3.27% |
| Health Science programmes (3-year degree) | 1,653 | 1,000 | 1.99% |
| Medicine and Odontology | 790 | 395 | 3.56% |
| Pharmacy, Food Science and Agro-Industries | 398 | 201 | 4.97% |
| Veterinary Science | 122 | 68 | 8.10% |
| Architecture | 976 | 371 | 4.09% |
| Civil Engineering (3-year degree) | 160 | 107 | 5.58% |
| Civil Engineering (4-year degree) | 159 | 95 | 6.53% |
| Nautical Science | 60 | 45 | 7.52% |
| Advanced Production Technologies (3-year degree) | 1,372 | 883 | 2.01% |
| Advanced Production Technologies (4-year degree) | 1,021 | 490 | 3.26% |
| Information and Communication (3-year degree) | 1,187 | 838 | 1.87% |
| Information and Communication (4-year degree) | 1,136 | 588 | 2.87% |
| Agriculture (3-year degree) | 241 | 182 | 3.68% |
| Agriculture (4-year degree) | 162 | 113 | 5.19% |
| Aviation | 67 | 54 | 6.04% |
| TOTAL | 26,620 | 15,228 | 0.53% |
NB: Campus-based universities.
In terms of the composition of the sample according to subject, the inclusion of the private universities in the survey has led to more programmes being accounted for in Teaching (7% more than in the previous study), 3-year Health Science programmes, advanced production technologies, ICT/Information and Communications Technologies (4% more), Economics and Business Administration and Management, and Communication Sciences (3% more).
The aim of this survey is to establish the degree to which the population of doctoral degree holders who were awarded their PhDs between 2006 and 2007 are satisfied with their studies and their current employment situation and to assess the impact of their studies on their current job situation.
The same criterion used in the graduate survey was again used here, and the survey covered PhD holders who had been awarded their doctoral degree three or four years prior to the survey so they were able to assess their doctoral degree studies from the point of view of their work experience. The reference population in this case was the doctoral degree population at the seven public universities in Catalonia between 2006 and 2007.
| Population | Sample obtained | Population response rate | Sample error (%) | |
|---|---|---|---|---|
| Universitat de Barcelona | 800 | 503 | 62.9% | 2.72% |
| Universitat Autònoma de Barcelona | 532 | 373 | 70.1% | 2.83% |
| Universitat Politècnica de Catalunya | 238 | 168 | 70.6% | 4.19% |
| Universitat Pompeu Fabra | 61 | 41 | 67.2% | 9.02% |
| Universitat de Girona | 62 | 45 | 72.6% | 7.87% |
| Universitat de Lleida | 51 | 37 | 72.5% | 8.70% |
| Universitat Rovira i Virgili | 80 | 58 | 72.5% | 6.93% |
| TOTAL | 1,824 | 1,225 | 67.2% | 1.64% |
| First PhD survey (2008) | 1,611 | 934 | 57.9% | 2.12% |
There was a 67.2% participation rate in this second survey, or 10% higher than in the first survey of the labour market outcomes of holders of a doctoral degree/PhD from Catalan universities carried out in 2008. An increase in the participation led to a reduction in the sample error from 2.12% in the 2008 survey to 1.64% in this second survey (2011). The university with the highest number of PhD holders is the Universitat de Barcelona (UB, 41%), followed by the Universitat Autònoma de Barcelona (UAB, 30%) and the Universitat Politècnica de Catalunya (UPC, 14%). In terms of the composition of the sample according to subject, there were no sample errors above 5%, which assures the good representativeness of the results obtained according to field of study.
| Field of study | Population | Sample | Response rate | Sample error (%) |
|---|---|---|---|---|
| Humanities | 243 | 175 | 72.0% | 4.01% |
| Social Sciences | 223 | 165 | 74.0% | 3.98% |
| Experimental Sciences | 682 | 436 | 63.9% | 2.88% |
| Health Sciences | 375 | 225 | 60.0% | 4.22% |
| Eng./Arch. | 301 | 224 | 74.4% | 3.39% |
| TOTAL | 1,824 | 1,225 | 67.2% | 1.64% |
Diagram 5. Distribution of PhD holders awarded their doctoral degrees in 2006 and 2007 in Catalonia according to field of study
The distribution of PhD holders according to field of study differs considerably from the distribution of graduates. The graduate population in the Social Sciences accounts for 44% of the total number of graduates, whereas only 13.5% of PhD holders were in the Social Sciences. Conversely, Experimental Sciences accounted for 35.6% of all PhD holders compared to 8.8% of all graduates.
Compared to the previous survey, the distribution in 2011 according to fields of study (disciplines) was similar, with a slight increase (3%) in the Experimental Sciences and Health Sciences, and a decrease of approximately 5% in the Social Sciences and Engineering and Architecture. There was no change in the Humanities.
Diagram 6. Distribution of PhD holders awarded their doctoral degrees in 2006 and 2007 in Catalonia according to gender
There were slightly more males than females (51% compared to 49%) among those who obtained a doctoral degree in the 2006 and 2007 academic years. In relation to the previous survey, however, there was a 5% increase in the case of female PhD holders.
Diagram 7. Distribution of PhD holders awarded their doctoral degrees in 2006 and 2007 in Catalonia according to age at the time of the survey
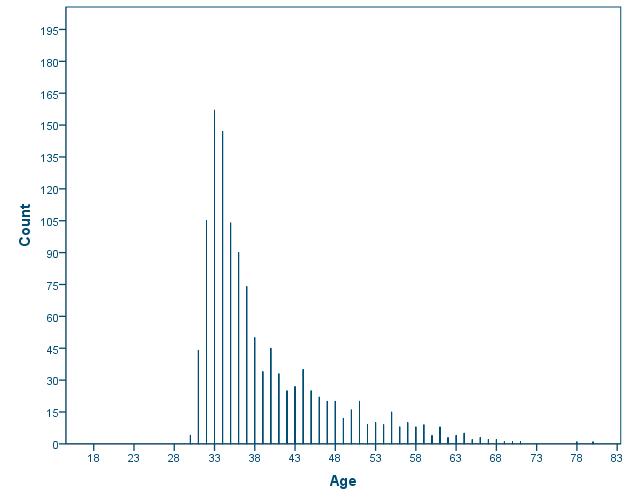
All of the doctoral degree holders who took part in the survey were aged between 30 and 80, with an average age of 39. 70% of the survey population was aged between 32 and 43. The average duration of a doctoral degree programme is six or seven years, and the average age of a doctoral degree holder is obviously older than that of a graduate.
This survey, which was carried out with the collaboration of the Institut Català de les Dones, (the Catalan government institute that designs, promotes and coordinates policy for women), is a continuation of the survey on Gender and graduate labour market outcomes (Bará et al., 2009), which was based on a comparative analysis of male and female graduates that used the results of the graduate labour market outcomes survey in 2008, three years after completing their studies, in which no significant gender-based differences were detected. The reference population was female and male graduates ten years after graduation (the university graduate population of the 2000-2001 graduating class that had already participated in the graduate labour market outcomes survey in 2004).
The specific objectives of the survey were:
- To describe the quality of graduate employment (labour market outcomes) in a series of selected degree programmes, ten years after graduation and on the basis of a series of gender-sensitive indicators.
- To analyse whether there are any differences in the quality of employment between male and female graduates with the same degree, ten years after graduation.
- To analyse whether there are any differences in the quality of employment within the same gender according to the degree studied, ten years after graduation.
- To assess any associated variables (personal attitudes, family situation, academic background, professional career, the type and awareness of an employer's supportive policies in terms of combining work and family life) that may account for these differences.
For the purposes of a statistical comparison according to gender, the survey population was selected from the graduate population with degrees in the five fields of study (disciplines) where the proportion of male and female graduates was similar and where selected degrees had a population of more than thirty (30) graduates. The population for this survey was selected from a population of 21,676 graduates that graduated in the 2000-2001 academic year, 11,456 of whom were interviewed in 2004 regarding their first job. Table 7 shows the distribution according to gender. The objective in the survey was to have a similar proportion for both male (45.3%) and female (54.7%) graduates participating in the survey.
| Population | Sample: female | Sample: male | Mostra: total | Response rate | Sample error (%) | |
|---|---|---|---|---|---|---|
| History | 272 | 104 | 88 | 192 | 70,6% | 3,92% |
| Business Management and Administration | 311 | 72 | 59 | 131 | 42,1% | 6,66% |
| Economics | 299 |
98 |
99 | 197 | 65,9% | 4,17% |
| Chemistry | 168 | 71 | 37 | 108 | 64,3% | 5,77% |
| Medicine | 249 | 101 | 33 | 134 | 53,8% | 5,88% |
| Industrial Engineering (Industrial Chemistry), 3-year degree | 346 | 41 | 51 | 339 | 98,0% | 0,77% |
| Agricultural Engineering (Agriculture and Livestock Industry), 3-year degree | 19 | 31 | ||||
| Agricultural Technology (Horticulture, Fruiticulture and Gardening), 3-year degree | 21 | 23 | ||||
| Agricultural Technology (Food and Agribusiness), 3-year degree | 54 | 39 | ||||
| Agricultural Engineering (Mechanisation and Rural Construction), 3-year degree | 4 | 9 | ||||
| Forestry Engineering (Forest Resources), 3-year degree | 16 | 24 | ||||
| Forest Engineering (Forest Industries), 3-year degree | 1 | 6 | ||||
| TOTAL | 1.778 | 602 | 499 | 1.101 | 61,9% | 1,86% |
Although it was not a selection criterion for the sample, the population selected for the survey is fairly well divided between the seven public universities in Catalonia, with 73% of the respondees being graduates from the Universitat de Barcelona, Universitat Autònoma de Barcelona, Universitat Politènica de Catalunya and the Universitat de Lleida. The distribution according to field of study practically corresponds with the percentage for the selected degree programmes, with the majority of the survey population being graduates in Engineering/Architecture (30.8%) and the Social Sciences (29.8%); 17.4% were in the Humanities, 12.2% the Health Sciences and 9.8% the Experimental Sciences .
Diagram 8. Graduate distribution ten years after graduation (2001 graduating class) from public universities in Catalonia according to age at the time of the survey
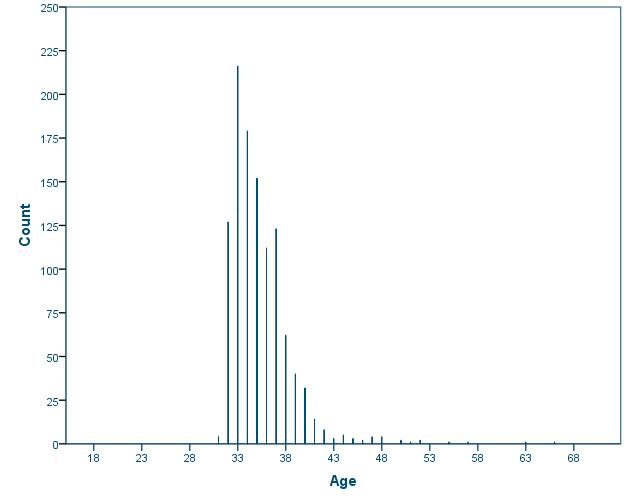
NB: Diagram based on 700 individuals whose date of birth was available.
All of the graduates who participated in the study were aged between 31 and 66. The average age however was 35, with 90% of the survey population aged between 32 and 40. According to gender, there are no significant differences in the age distribution between male and female graduates, i.e. the average for both male and female graduates is around 35, with a range from 31 and 66 for both genders. This age is higher than the average for graduates and slightly lower than that for doctoral degree holders.
Emancipation and family
The majority of the 1,101 respondees are characterised as living as a couple (75.7% of the respondees), more than half of which (55.9%) have children. Almost 60% of these are single-child families, 36% have two children, and 4% have more than two. In terms of their children's age, 95% of families had at least one child who was younger than six. The remaining 5% had children who were over 7.
Diagram 9. Graduate distribution ten years after graduation (2001 graduating class) from public universities in Catalonia according to the type of home and number of children at the time of the survey
55.9% of those living as a couple have a child/children. Of these, 60% have one child, 36% have two children and 4% have three or more children.
This new series of variables, which includes for example family make-up, have not been included before in earlier surveys and they provide additional information that may help to explain the effect of family dynamics on the differences in the quality of graduate labour market outcomes according to gender.
We are very grateful to the 16,182 people who participated in the graduate labour market outcomes survey and who were kind enough to spend several minutes of their time to respond to the AQU surveys.
1 The graduate population from the Open University of Catalonia (UOC) is different to the typical campus-based university graduate population: more than 60% had already completed a previous programme on admission and around 90% worked full-time during their studies. The results for the UOC are therefore given in a section on their own. In the second survey, a total of 954 graduates from the UOC participated (47.8% of the UOC's graduate population), with an equal balance of males (49.9%) and females (50.1%). In terms of the distribution of the courses offered at the UOC, 70% of the graduates from the UOC who were interviewed had taken degrees in the Social Sciences (mainly Business Studies, Economics and Business Administration), 20% had taken degrees in either Engineering or Architecture and 9% in the Humanities. In the 2011 survey, the participants were aged between 27 and 68, with an average age of 39, and 70% of the survey population was aged between 31 and 45.


![]()
Via Laietana, 28, 5a planta 08003 Barcelona. Spain. Tel.: +34 93 268 89 50
© 2011 AQU Catalunya - Legal number B-21.910-2008