74
September 2014


ARTICLES
Analysis on the effectiveness of reports issued on tenure-track (pre-/non-career grade) teaching staff (2003-2013)
Esteve Arboix Codina - Head of Teaching Staff Assessment department
Since the requirement for assessment reports to be issued for tenure-track (pre-/non-career grade) teaching staff was first introduced in 2003, more than 6,600 cases have been assessed, of which 60% received a favourable evaluation. As stipulated in law, a position as a pre-/non-career grade (tenure-track) university lecturer (lector) opens the door to a career in academia (as contract staff) and subsequently leads to higher categories with an open-ended contract.
This article describes three relevant variables used to analyse the effectiveness of these assessment reports. The three variables used are the success rate, the age at which applicants receive a favourable assessment, and the appeal rate.
These variables were chosen to undertake an analysis of the effectiveness of reports being issued for tenure-track (pre-/non-career grade) teaching staff because they very graphically portray whether assessment has been made correctly or not. Following on from the combination of traffic light colours, green represents a high success rate, a young age when receiving a favourable report and a low number of appeals lodged, whereas red represents a low success rate, an older age when receiving a favourable report and a high number of appeals lodged. The issuance of reports for tenure-track (pre-/non-career grade) teaching staff is an administrative procedure, whereby the right to appeal means that any applicant can appeal the decision of the examining panel in order for their application for assessment to be reviewed.
The setting of thresholds is clearly a relatively arbitrary process. Nevertheless, from the point of view of the review panels that covered the different subject areas, the following thresholds were accepted as being satisfactory:
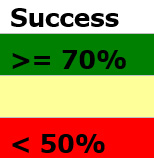
- For the success rate (percentage of favourable assessments out of the total number of applications), the following scale:
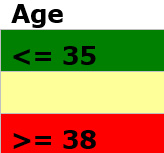
- For the age when applicants received a favourable report, the following scale:
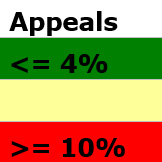
- For the number of appeals lodged, or appeal rate (percentage of appeals out of the total number of applications), the following scale:
Results
For the 2003-2013 period overall, the success rate was 60%, the average age when a favourable report was received was 35 and the appeal rate was 8%.
The following table shows the disaggregated data according to subject area:
Table 1. Effectiveness (2003-2013)
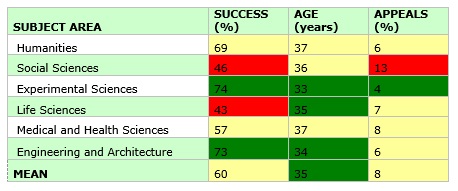
In accordance with the established criteria, the first impression is that, broadly speaking, the scenario is reasonably satisfactory. However, the age of 35 is often pointed out as being relatively high to start an academic career, as defined for a position as pre-/non-career grade (tenure-track) university lecturer.
As far as the red cells in the table are concerned:
- It can be seen that the success rate in the Social Sciences was below 50% and that the appeal rate was 13%, 5 percentage points higher than the mean for all subject areas. In this regard, mention should be made of the fact that in the Social Sciences, and often in the Humanities as well, there are different subjects that perform very differently in terms of the results, assessment mechanisms and assessment benchmarks, which may explain the high appeal rate.
- In Life Sciences, the success rate was even lower than in Social Sciences although the appeal rate was 1 percentage point below the mean. This means that, although it is quite difficult to successfully pass assessment, the outcomes are better accepted by the candidates than by those in Social Sciences.
As far as the green cells in the table are concerned, it is noteworthy that in Experimental Sciences there was a high rate of success, a lower than average age and a low appeal rate. It was also similar in Engineering and Architecture.
The data can also be analysed according to two five-year periods (2003-2008 and 2009-2013) to see if there have been any significant changes over the ten year period.
Table 2. Effectiveness (2003-2008)
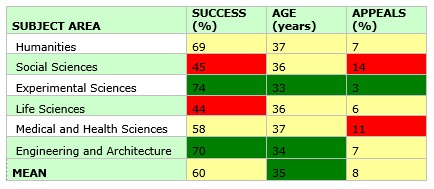
Table 3. Effectiveness (2009-2013)
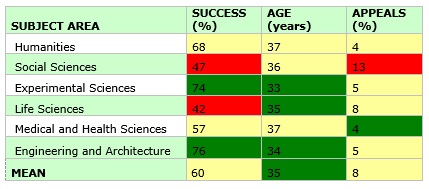
Broadly speaking, it can be seen there are no big differences between the two periods. Nevertheless, it is pointed out that:
- In Humanities, there was a drop of 3 percentage points in the appeal rate.
- In Social Sciences the appeal rate only decreased 1 percentage point.
- In Experimental Sciences and Life Sciences the appeal rate went up slightly, by 2 percentage points.
- One positive development was the decrease in the appeal rate in Medical and Health Sciences (from 11% to 4%).
- In Engineering and Architecture the appeal rate went down 2 percentage points.
The results of this analysis have been submitted to the Agency's QA commissions and Board.


![]()
c/. dels Vergós, 36-42. 08017 Barcelona. Tel.: +34 93 268 89 50
© 2014 AQU Catalunya - Legal number B-21.910-2008