86
July 2017


ARTICLES
Sixth survey of the transition into employment of graduates of universities in Catalonia
Anna Prades and Dani Torrents
The 2017 survey of the transition into employment of graduates (graduate employment outcomes) from universities in Catalonia covered a total number of 15,563 people who graduated in the 2012-2013 academic year (aside from Medicine, for which the baseline academic year was 2009-2010), a figure that accounts for half of the graduate population completing both pre- and post-Bologna programmes in the academic year of reference. In this latest survey, all of the public and private universities in Catalonia took part, together with 31 affiliated and partner schools and institutes, which together represent almost all the higher education and university system in Catalonia.
Table 1. Population, sample, response rate and sample error of the 2017 survey of the transition into employment of graduates (graduate employment outcomes)
| Population | Sample | Response rate | Sample error |
|---|---|---|---|
| 30.262 | 15.563 | 51,4% | 0,56% |
The main results and findings are set out below. More detailed information can be consulted here.
Rate of employment
The data from the 2017 survey show that 9 out of 10 graduates were in employment at the time of the survey, and only 6% were looking for a job. The unemployment rate was highest in Humanities (11%).
Table 2. Labour status of graduates according to field of discipline
| Employed | Unemployed | Inactive | |
|---|---|---|---|
| Humanities | 82,6% | 11,2% | 6,2% |
| Social Sciences | 89,7% | 6,1% | 4,2% |
| Experimental Sciences | 84,7% | 9,3% | 6,0% |
| Health Sciences | 89,5% | 6,1% | 4,4% |
| Engineering Sciences | 93,2% | 4,6% | 2,2% |
|
Total |
89,3% | 6,6% | 4,2% |
Education/job skills match
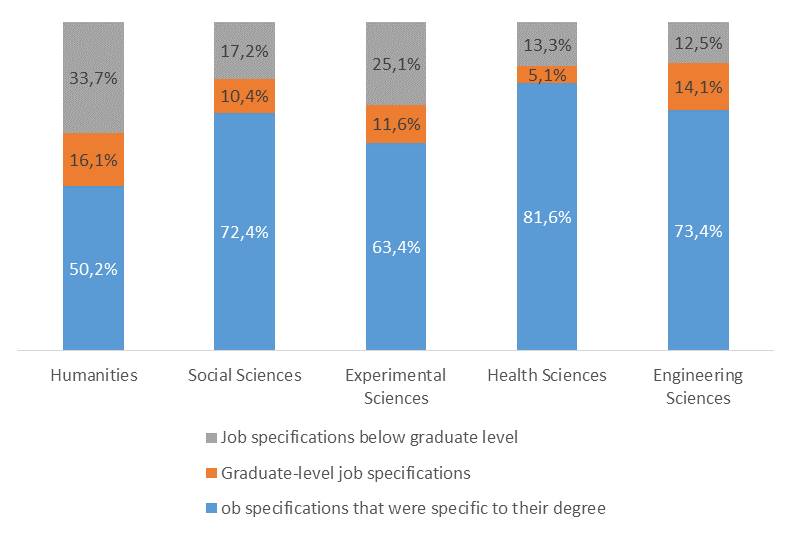
In addition to a high rate of employment, 8 out of 10 graduates had graduate-level job specifications. And of these 8 graduates, 7 had job specifications that were specific to their degree. Differences were again evident according to field of discipline: the education/jobs skills match was highest for graduates in Health Sciences (81%) and lowest in Humanities (50%).
Figure 1. Education/jobs skills match according to field of discipline
Trends in the employment rate, education/job skills match and employment conditions of graduates
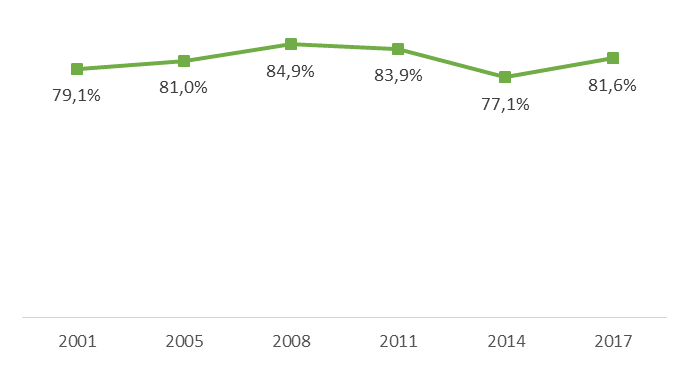
As can be seen from the figure below there was a recovery in the employment rate and education/job skills match compared to the previous survey although the levels were still below those prior to the economic crisis. The improvement in the employment rate was particularly noticeable in Architecture and Philosophy & History, which were two of the subject areas most affected by the economic crisis. The increase was also evident in Education, which has clear links to the public sector.
Figure 2. Trend in the employment rate of graduates from public universities in Catalonia
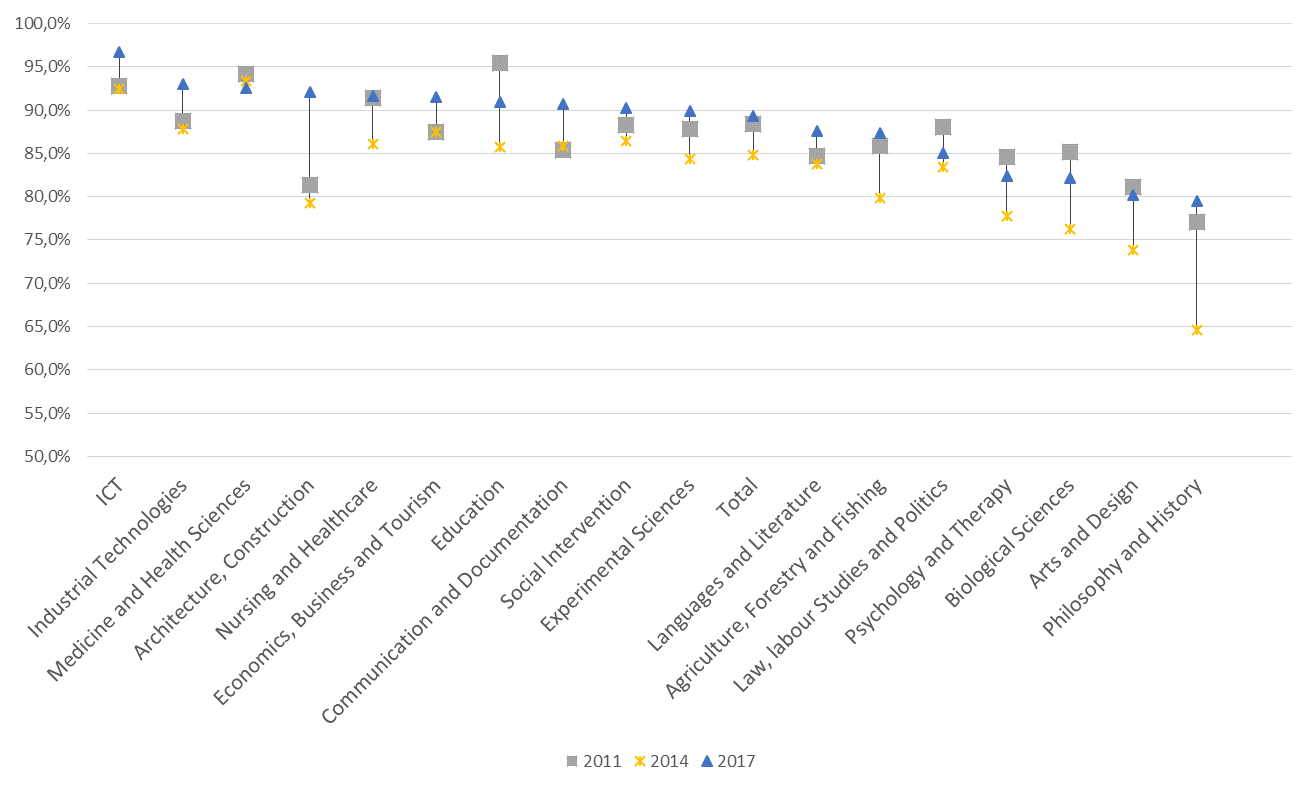
Figure 3. Trend in the percentage of graduates with graduate-level job specifications (both specific to a given degree and non-specific)
Nevertheless, there was a levelling-off in the employment conditions of graduates (full-time work and contractual stability), aside from salaries where there was an increase (the percentage of those earning under 12,000 went down from 22% to 20% over the last three years), and in the job satisfaction of those with graduate-level job specifications (the previous rating was 7.6 compared to 7.8 in 2017).
Figure 5. Trends in the percentage of graduates in full-time work
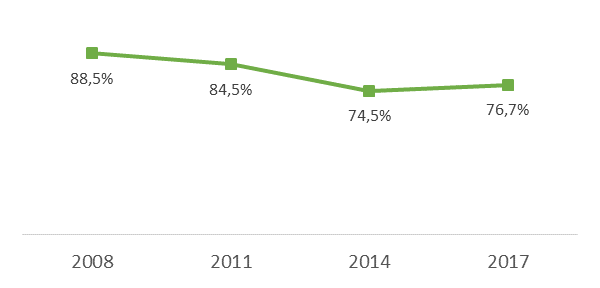
Figure 5. Trends in the types of job contract of graduates
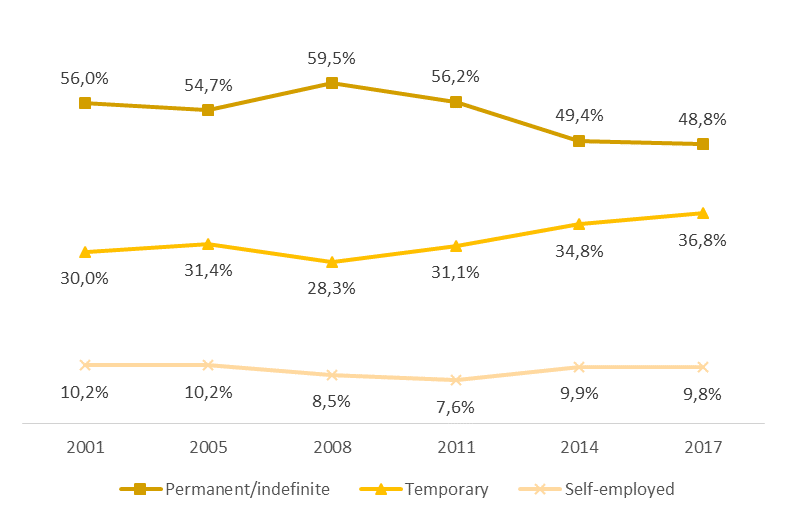
There were significant differences in the employment conditions of graduates according to the field of discipline: Engineering Sciences had the best indicators for stability, earnings and full-time employment, ahead of all the others.
Table 3. Percentage of graduates with full-time employment, and an indefinite contract; self-employed graduates and those earning under 12,000 euros, according to field of discipline
| Full-time employment | Indefinite contract | Self-employed | Under 12,000 a year | |
|---|---|---|---|---|
| Humanities | 59,6% | 33,8% | 15,2% | 43,7% |
| Social Sciences | 78,8% | 54,0% | 8,9% | 22,4% |
| Experimental Sciences | 77,5% | 38,4% | 3,6% | 25,2% |
| Health Sciences | 63,4% | 36,6% | 13,3% | 28,5% |
| Engineering Sciences | 92,3% | 61,8% | 13,8% | 9,6% |
Entry to the labour market: time taken and pathways to employment
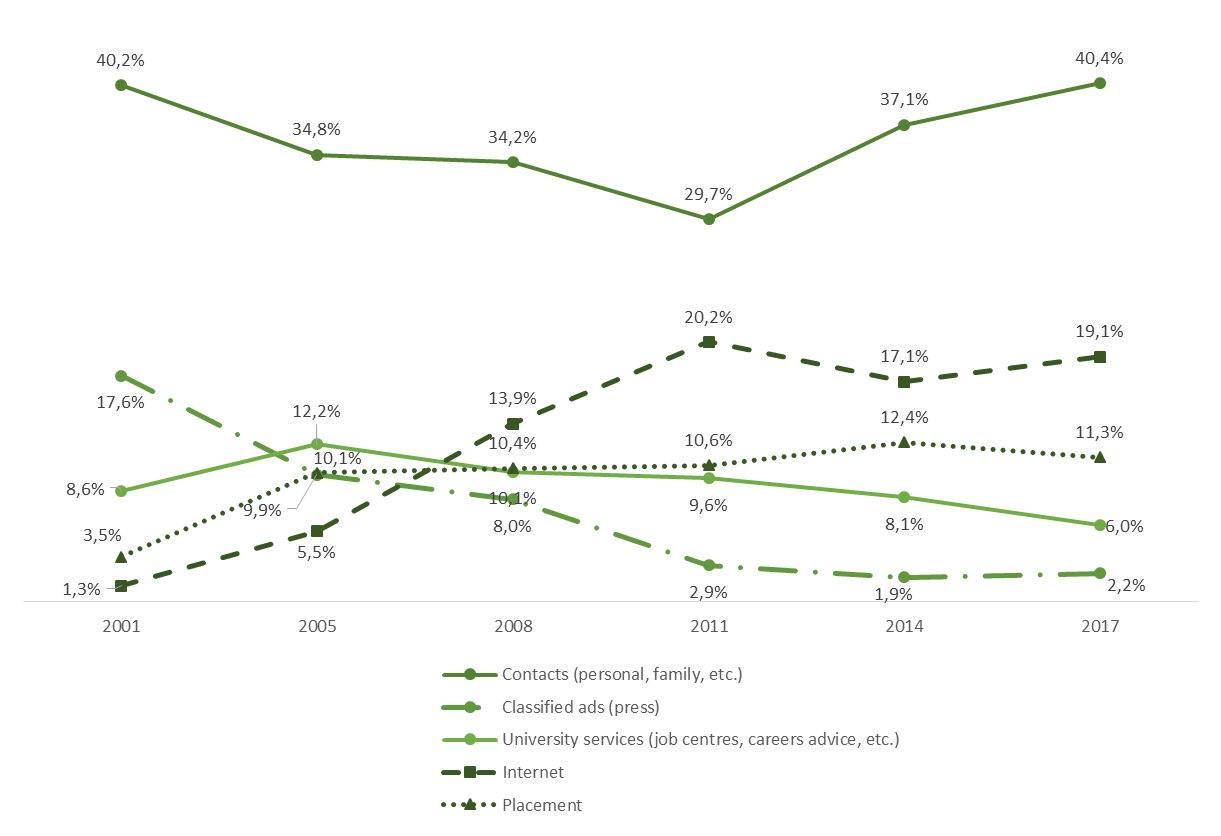
Approximately 7 out of 10 graduates found work within three months, a similar proportion to 2014. Among those looking for work, there was a drop in those who were unemployed for six months or longer (from 51% to 33%). The main entry pathways to the labour market were contacts and the Internet (which accounted for 60% of actively employed graduates). On the other hand, there was a drop in the importance of university-related job services and placements from 20% to 17%.
Figure 6. Trends in the five main job pathways
International mobility
Working abroad remains a minority choice for graduates (3.6% of all graduates). Although this is a low percentage, it has been gradually increasing since 2011 (1 percentage point).
Figure 7. Place of work of those in employment in 2017
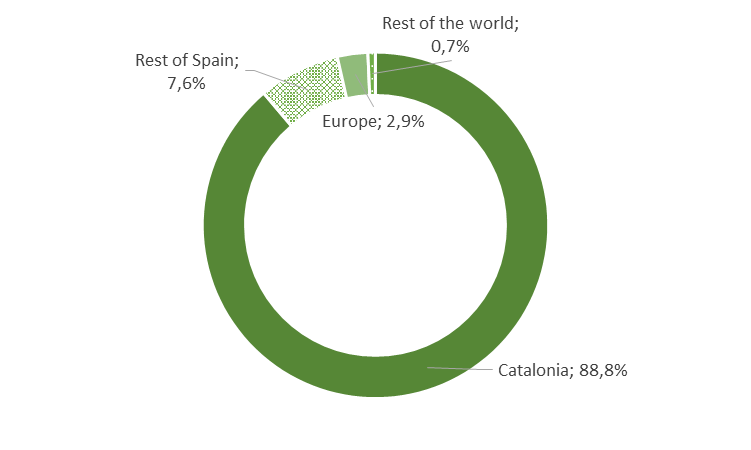
Table 4. Trend in the percentage of graduates who were working abroad, according to field of discipline
| 2011 | 2014 | 2017 | |
|---|---|---|---|
| Humanities | 5,2% | 5,1% | 4,8% |
| Social Sciences | 2,1% | 2,0% | 2,5% |
| Experimental Sciences | 2,0% | 4,0% | 5,2% |
| Health Sciences | 1,9% | 2,4% | 3,4% |
| Engineering Sciences | 3,2% | 4,7% | 5,0% |
| Total | 2,6% | 3,0% | 3,6% |
Graduate satisfaction with degree studies and skills acquisition
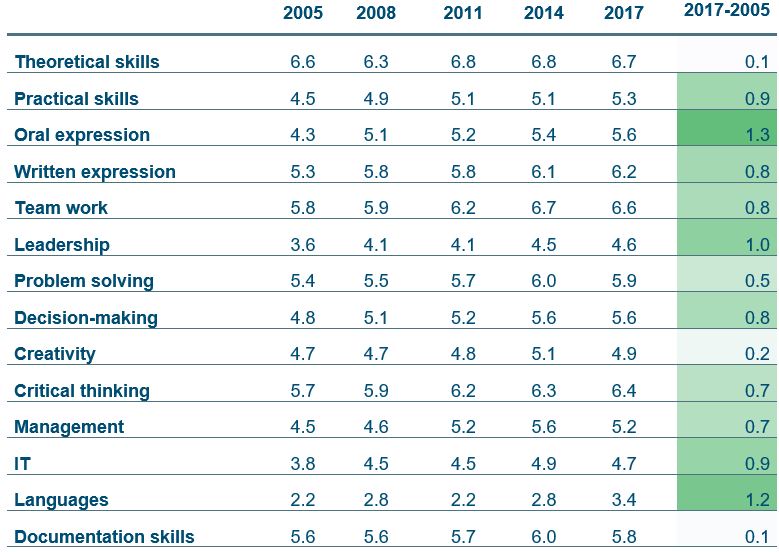
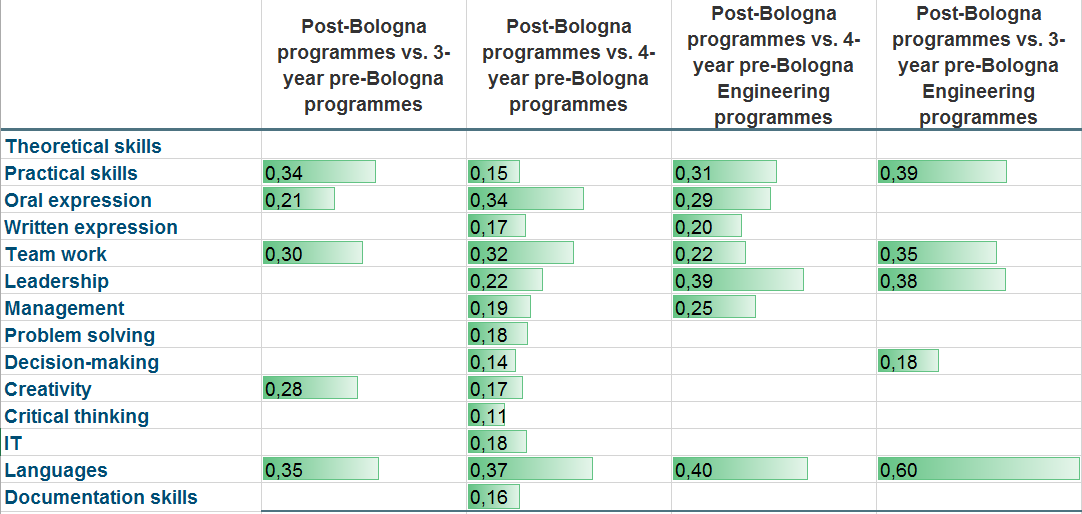
Since both 2011 and 2005, the trend has been towards improvements in the core skills acquired by graduates. The biggest improvement has been in oral expression, languages and leadership.
Table 5. Trends in graduate satisfaction with core skills' acquisition
In the 2017 study, respondents included graduates from both pre-Bologna and post-Bologna (EHEA) programmes. This allowed for the identification of significant differences in the level of skills acquisition (learning and teaching) in degrees covered by both pre- and post-Bologna academic regulations through the transcripts of records (student records) and according to institution.
The data and figures from the analysis show that post-Bologna programmes have resulted in an improvement in skills acquisition, especially as regards languages, although this skill continues to be an outstanding issue.
Table 6. Impact of post-Bologna programmes on skills acquisition
Further studies after graduation
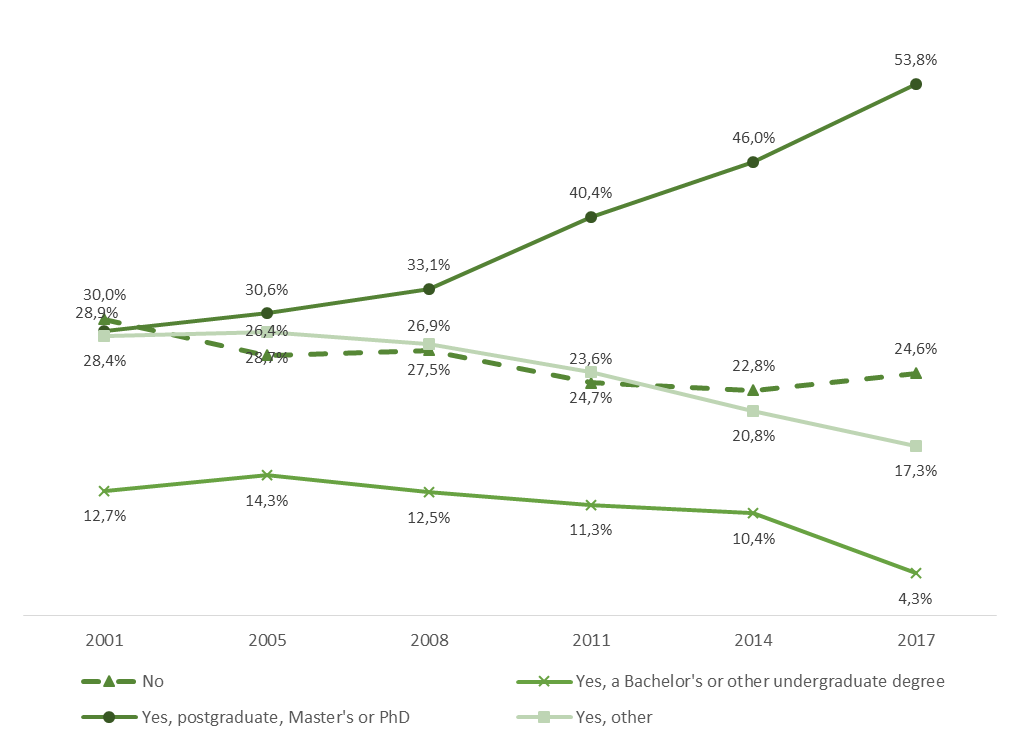
Another trend evident from this study is that graduates are extending their time spent studying through postgraduate, Master's, doctoral and other programmes. In the 2017 survey, more than half of all graduates went on to take further studies in higher education.
Figure 8. Trend in graduates taking further studies in higher education
Would graduates take the same degree programme again?
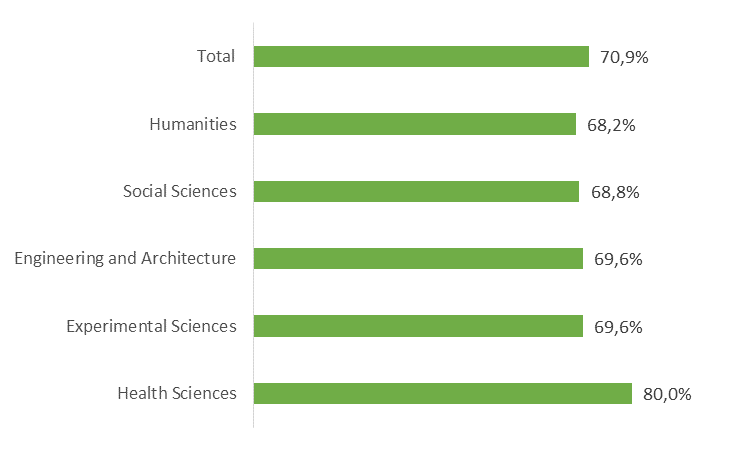
In general, graduates were satisfied with their degree programme and approximately 3 out of 4 would take the same degree again. The proportion ranged from 80% in Health Sciences to 68.2% in Humanities.
Figure 9. Trend in the percentage of graduates who would take the same degree programme again, according to field of discipline
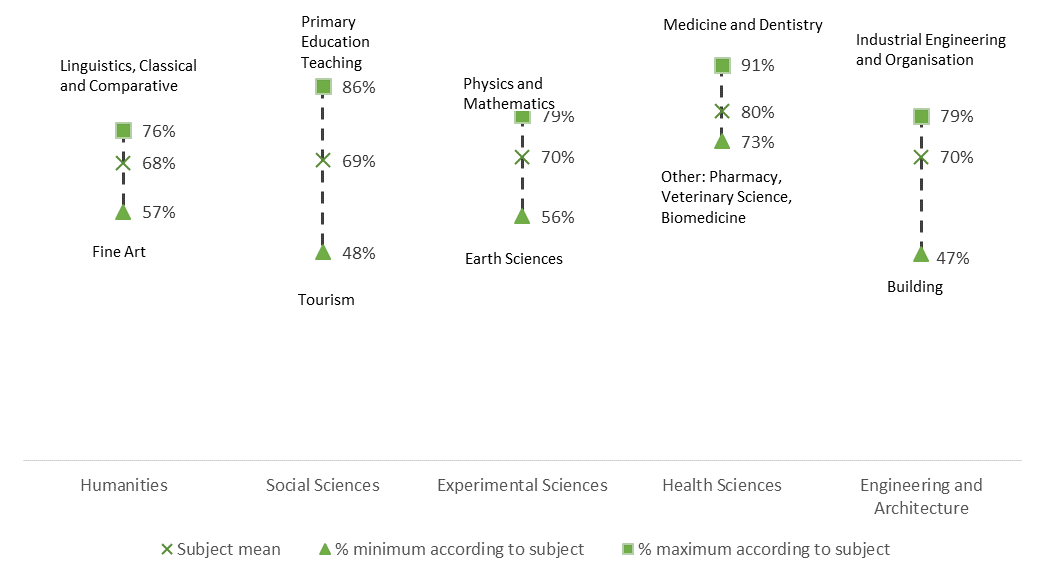
Nevertheless, the intention of graduates to take the same degree again was highly variable across the various fields of discipline. For example, the percentage that would take the same degree again in Engineering Sciences ranged from 47% in Building to 79% in Industrial Engineering and Organisation. The highest level of dispersion was in Social Sciences, where only 48% of graduates in Tourism would take the same degree again, compared to 86% in Primary Education Teaching.
Figure 10. The percentage of graduates who would take the same degree programme again according to field of discipline (maximum and minimum according to each discipline)


![]()
c/. dels Vergós, 36-42. 08017 Barcelona. Tel.: +34 93 268 89 50
© 2017 AQU Catalunya - Legal number B-21.910-2008